The goal of our third newsroom diversity report is to be transparent and hold ourselves accountable for the composition of our newsroom. Like the Winter 2021 report, this report is being published later than we intended. Because of how long it took to publish, we have decided to combine the data from both our Spring and Fall 2021 surveys. We regret the extremely delayed publication of the Spring 2021 report, but we hope that this information will help to show how new members from the Class of 2025 have affected NBN’s demographics. NBN will work to ensure our diversity survey is given earlier in the quarter so future reports will be published in a more timely manner.
NBN would like to thank the Daily Northwestern for its precedent of publishing a quarterly diversity report and calling on other publications to do the same. Like the Daily, NBN urges other Northwestern student publications to critically assess the demographic makeup of their newsrooms and hold themselves accountable for their shortcomings.
Each successive quarter over the last year, we have had fewer respondents, which we believe is the result of the general progression of stress during a mostly virtual school year. Fall 2021 was an exception due to the influx of new students. In Fall 2020 we had 101 respondents, in Winter 2021 we had 71, in Spring 2021 we had 66 and in Fall 2021 we had 73.
We are committed to making our newsroom reflective of the Northwestern undergraduate body. We will continue to work on recruitment, retention and building community within both our staff and the greater Northwestern community; this is explained in further detail in this report’s closing section.
As in previous diversity reports, no distinction will be made between web and print staff due to the overlap and collaboration between both of these groups. For reference, our web staff is roughly 50% larger than our print staff.
Race & ethnicity
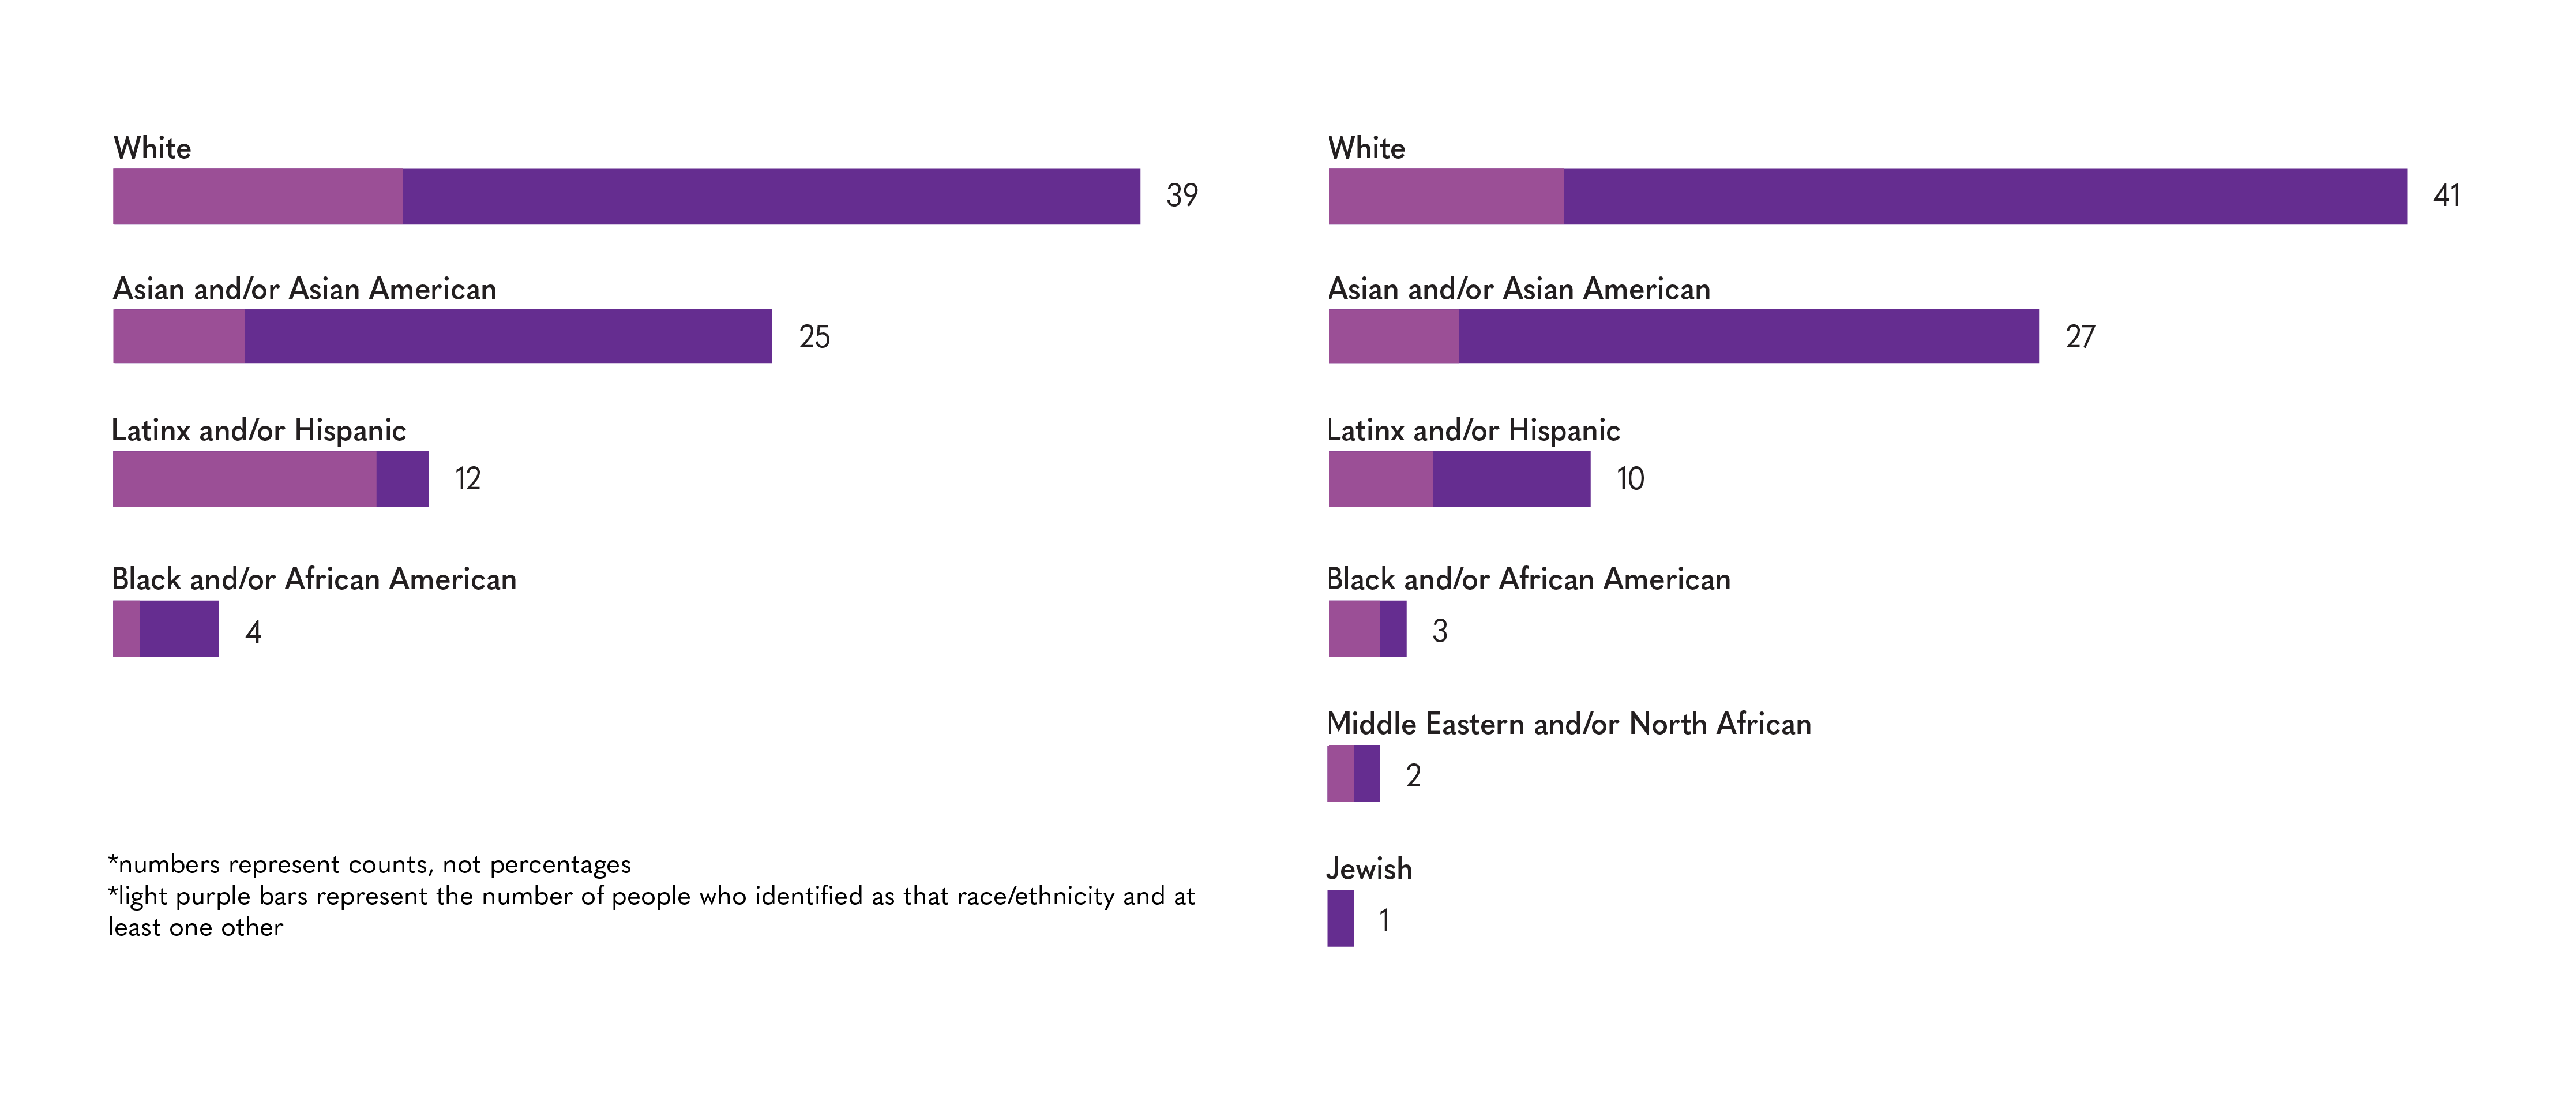
NBN’s Spring and Fall statistics for race and ethnicity, respectively.
NBN’s staff remains majority white. The percentage of respondents who only identified as white has fluctuated over the past two quarters, from 42.2% in Winter to 55.2% in Spring and then 43.8% in Fall. The percentage of staff who identified as white and another race or ethnicity has also fluctuated. In Winter, it was 18.3%; in Spring, it was 3.0%; in Fall, it was 12.3%. The large drop in Spring can be attributed to changes in data collection methods.
In Spring 2021, we created a separate question for staff members to indicate whether or not they identify as Latinx/Hispanic. In Winter, we included Latinx/Hispanic as an option in our question on race and ethnicity. In Spring, some staffers expressed concern regarding the intersection between Latinx/Hispanic identity and race. In an attempt to remedy this, we created a separate question for respondents to indicate Latinx/Hispanic identity and removed it as an option on the existing race/ethnicity question. However, the data collected with this updated survey did not accurately reflect multiracial identities. Of the respondents who identified as Latinx/Hispanic in Spring, three-quarters identified racially as white. We decided to format the Fall survey like our Winter one, moving the option of Latinx/Hispanic identity back under the question of race and ethnicity.
The overall percentage of Latinx/Hispanic-identifying respondents fell from 16.9% in Winter and 17.9% in Spring to 13.7% in Fall.
The percentage of Asian American staff has remained relatively stable throughout the past year – 32.4% in Winter, 37.9% in Spring and 37.0% in Fall. In both Spring and Fall, we asked Asian American staffers to specify their regional identification to reflect the diversity of the Asian diaspora. In Spring, four-fifths of Asian American staffers identified as East Asian; in Fall, this majority fell to two-thirds.
The percentage of Black and/or African American staff has fluctuated but remained low: 2.8% in Winter, 6.1% in Spring and 4.1% in Fall; however, these fluctuations can be attributed to changes in the size of the overall staff. The amount of Black and/or African American staffers only changed by one each quarter, rising from three staffers to four before falling back to three. NBN has continuously failed to bring Black and/or African American students on staff.
According to data from the University for the 2020-21 school year, the total undergraduate population at Northwestern is 41.5% white, 19.6% Asian, 13.0% Latino/Hispanic, 5.9% Black or African American and 6.3% two or more races. The data also indicated that among the undergraduate population, there are only seven American Indian or Alaska Native students and only two Native Hawaiian or other Pacific Islander students, although anecdotal evidence from NBN staffers suggests these numbers may be underreported. These data did not record the overlapping identities of students who identified as Latino/Hispanic or who identified as more than one non-Hispanic race, which makes direct comparison difficult. Based on these data, NBN’s newsroom overrepresents white, Asian and Latinx/Hispanic students and underrepresents Black and/or African American students compared to the overall undergraduate population at NU.
Gender identity
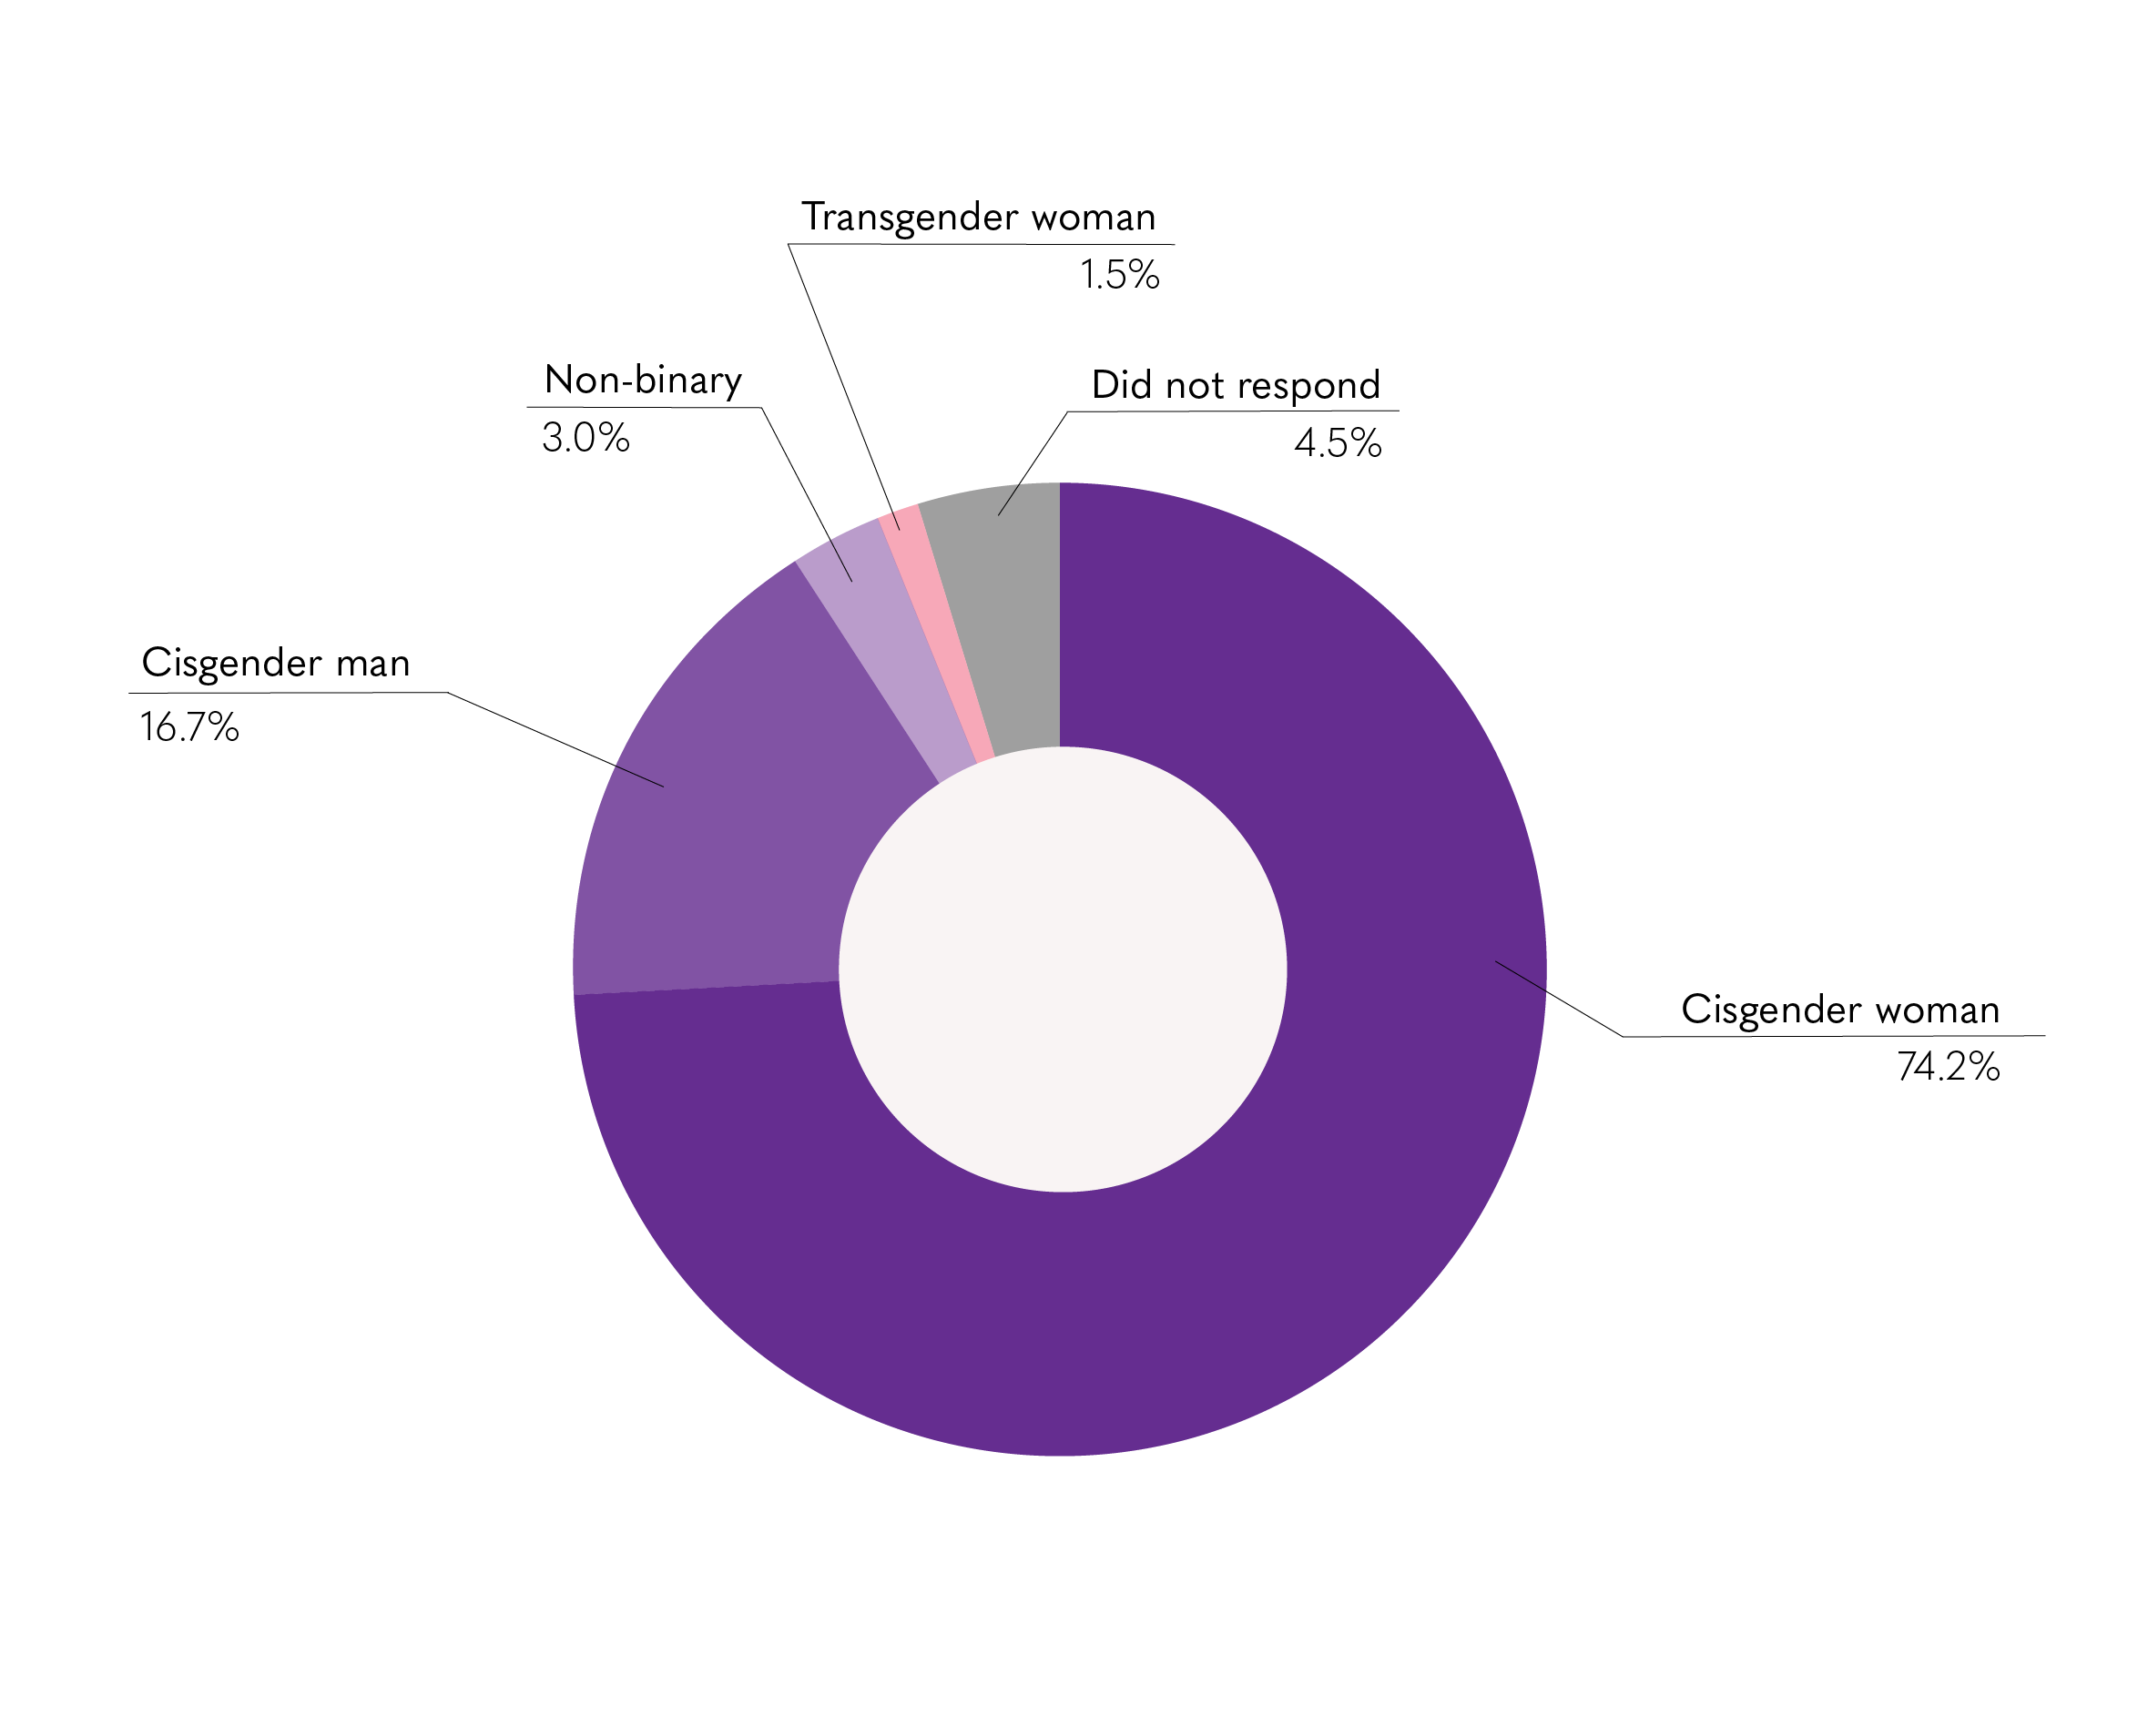
NBN’s Spring and Fall statistics for gender identity, respectively.
The data from Spring and Fall Quarters generally reflected the same demographic breakdown as the data from Winter in regards to gender identity. Like previous quarters, our newsroom remains predominantly woman-identifying. The percentage of women on our staff remained around 76% in both Winter and Spring, but fell to 65.8% in Fall. These numbers can mostly be attributed to changes in other gender groups; the number of women fell from 54 in Winter to 49 in Spring and 48 in Fall. The number of men on staff also remained stable from Winter (13 staffers, 18.3% of staff) to Spring (12 staffers, 18.8% of staff) but grew in the Fall (18 staffers, 24.7% of staff). The percentage of staff who identified with a gender outside of the gender binary fell from 9.9% in Winter to 3.1% in Spring before rising to 8.2% in Fall.
In comparison to the overall Northwestern undergraduate population, cisgender women remain the group that is overrepresented. According to data from the University for the 2020-21 school year, 51.9% of undergraduate students are women and 48.1% are men. These data do not represent students whose gender falls outside the gender binary, which means they do not accurately represent the gender distribution of NU undergraduate students; however, this was the best resource NBN could find for comparison.
It is important to note that differences in data collection can make direct comparison difficult. In the Winter 2021 survey, we asked our staffers to indicate their gender identity (e.g. woman, man, non-binary) separately from whether they identify as cisgender or transgender. This led to the creation of the categories woman (unspecified) and man (unspecified) which had to be recorded separately from binary staffers who indicated whether they identify as cisgender or transgender. In our Spring and Fall surveys, we separated cisgender and transgender options to better identify the range in our staff’s gender identities.
Each quarter, we provided staffers four options outside the binary options of man or woman: agender, genderfluid, gender-nonconforming and non-binary. We recognize that these four terms do not reflect the entirety of gender as it is experienced outside of the gender binary, so we have included a write-in option for staffers whose gender identity does not fall under the scope of the offered choices since Winter 2021.
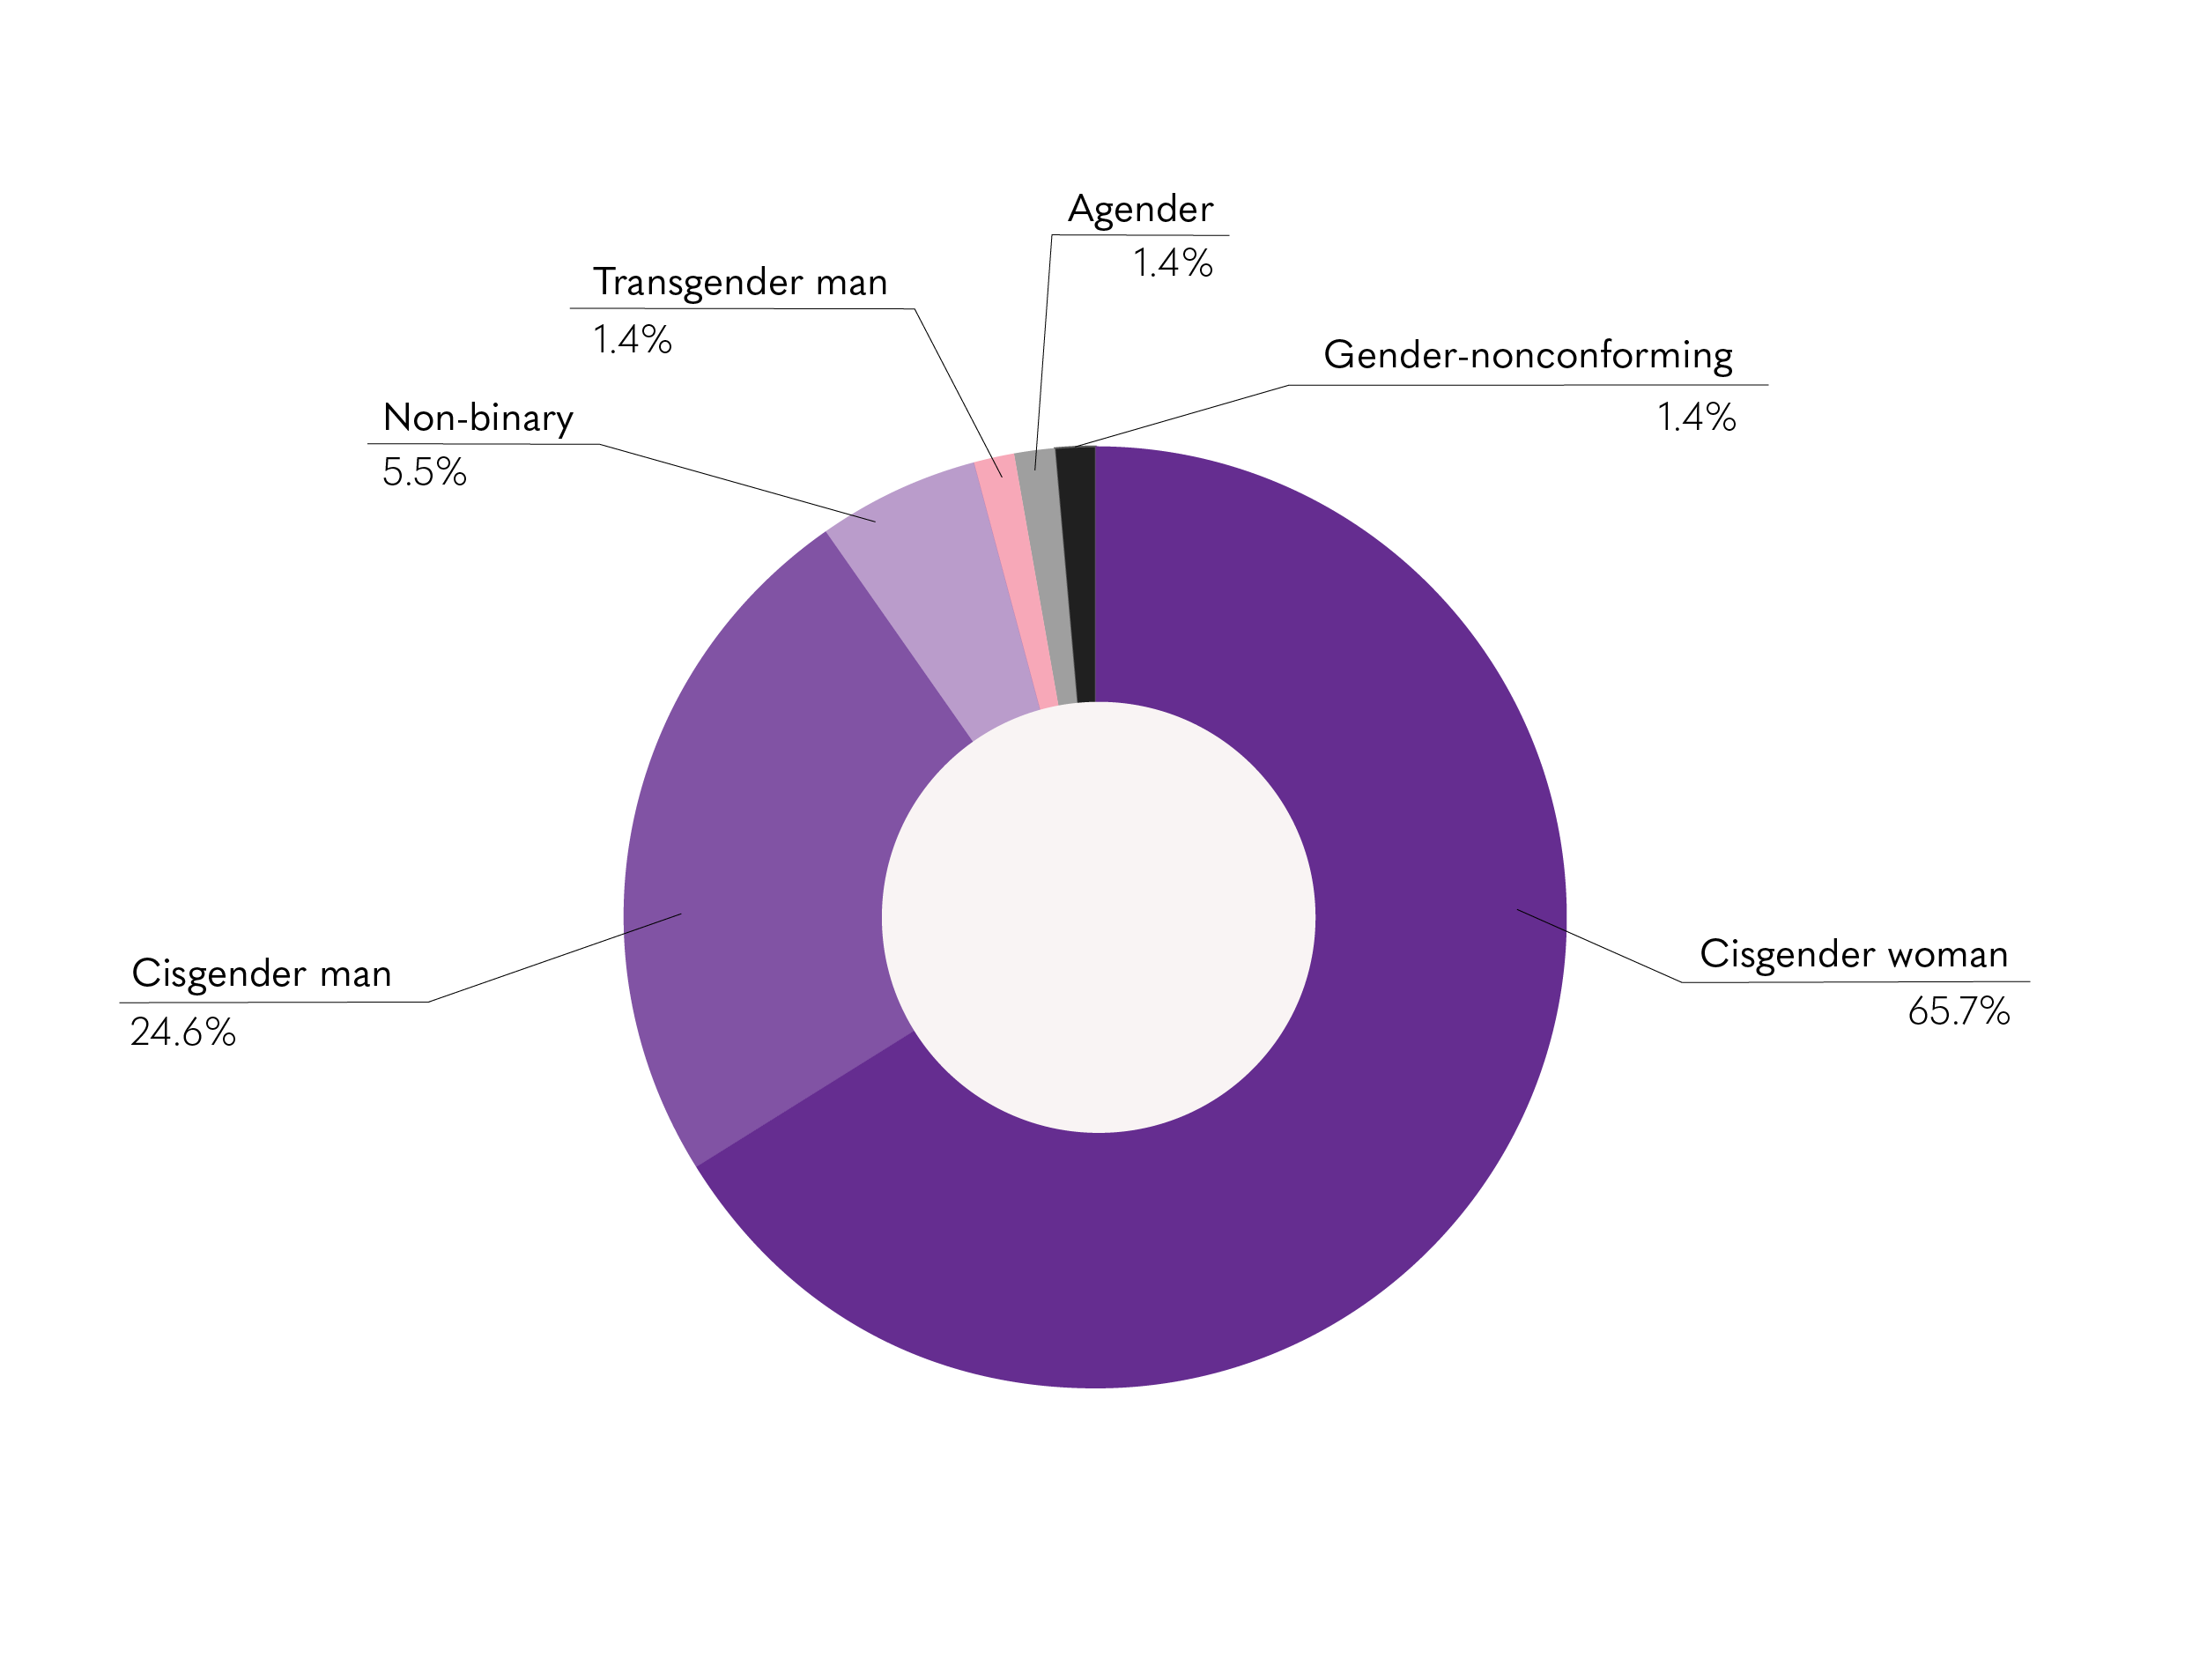
Sexuality
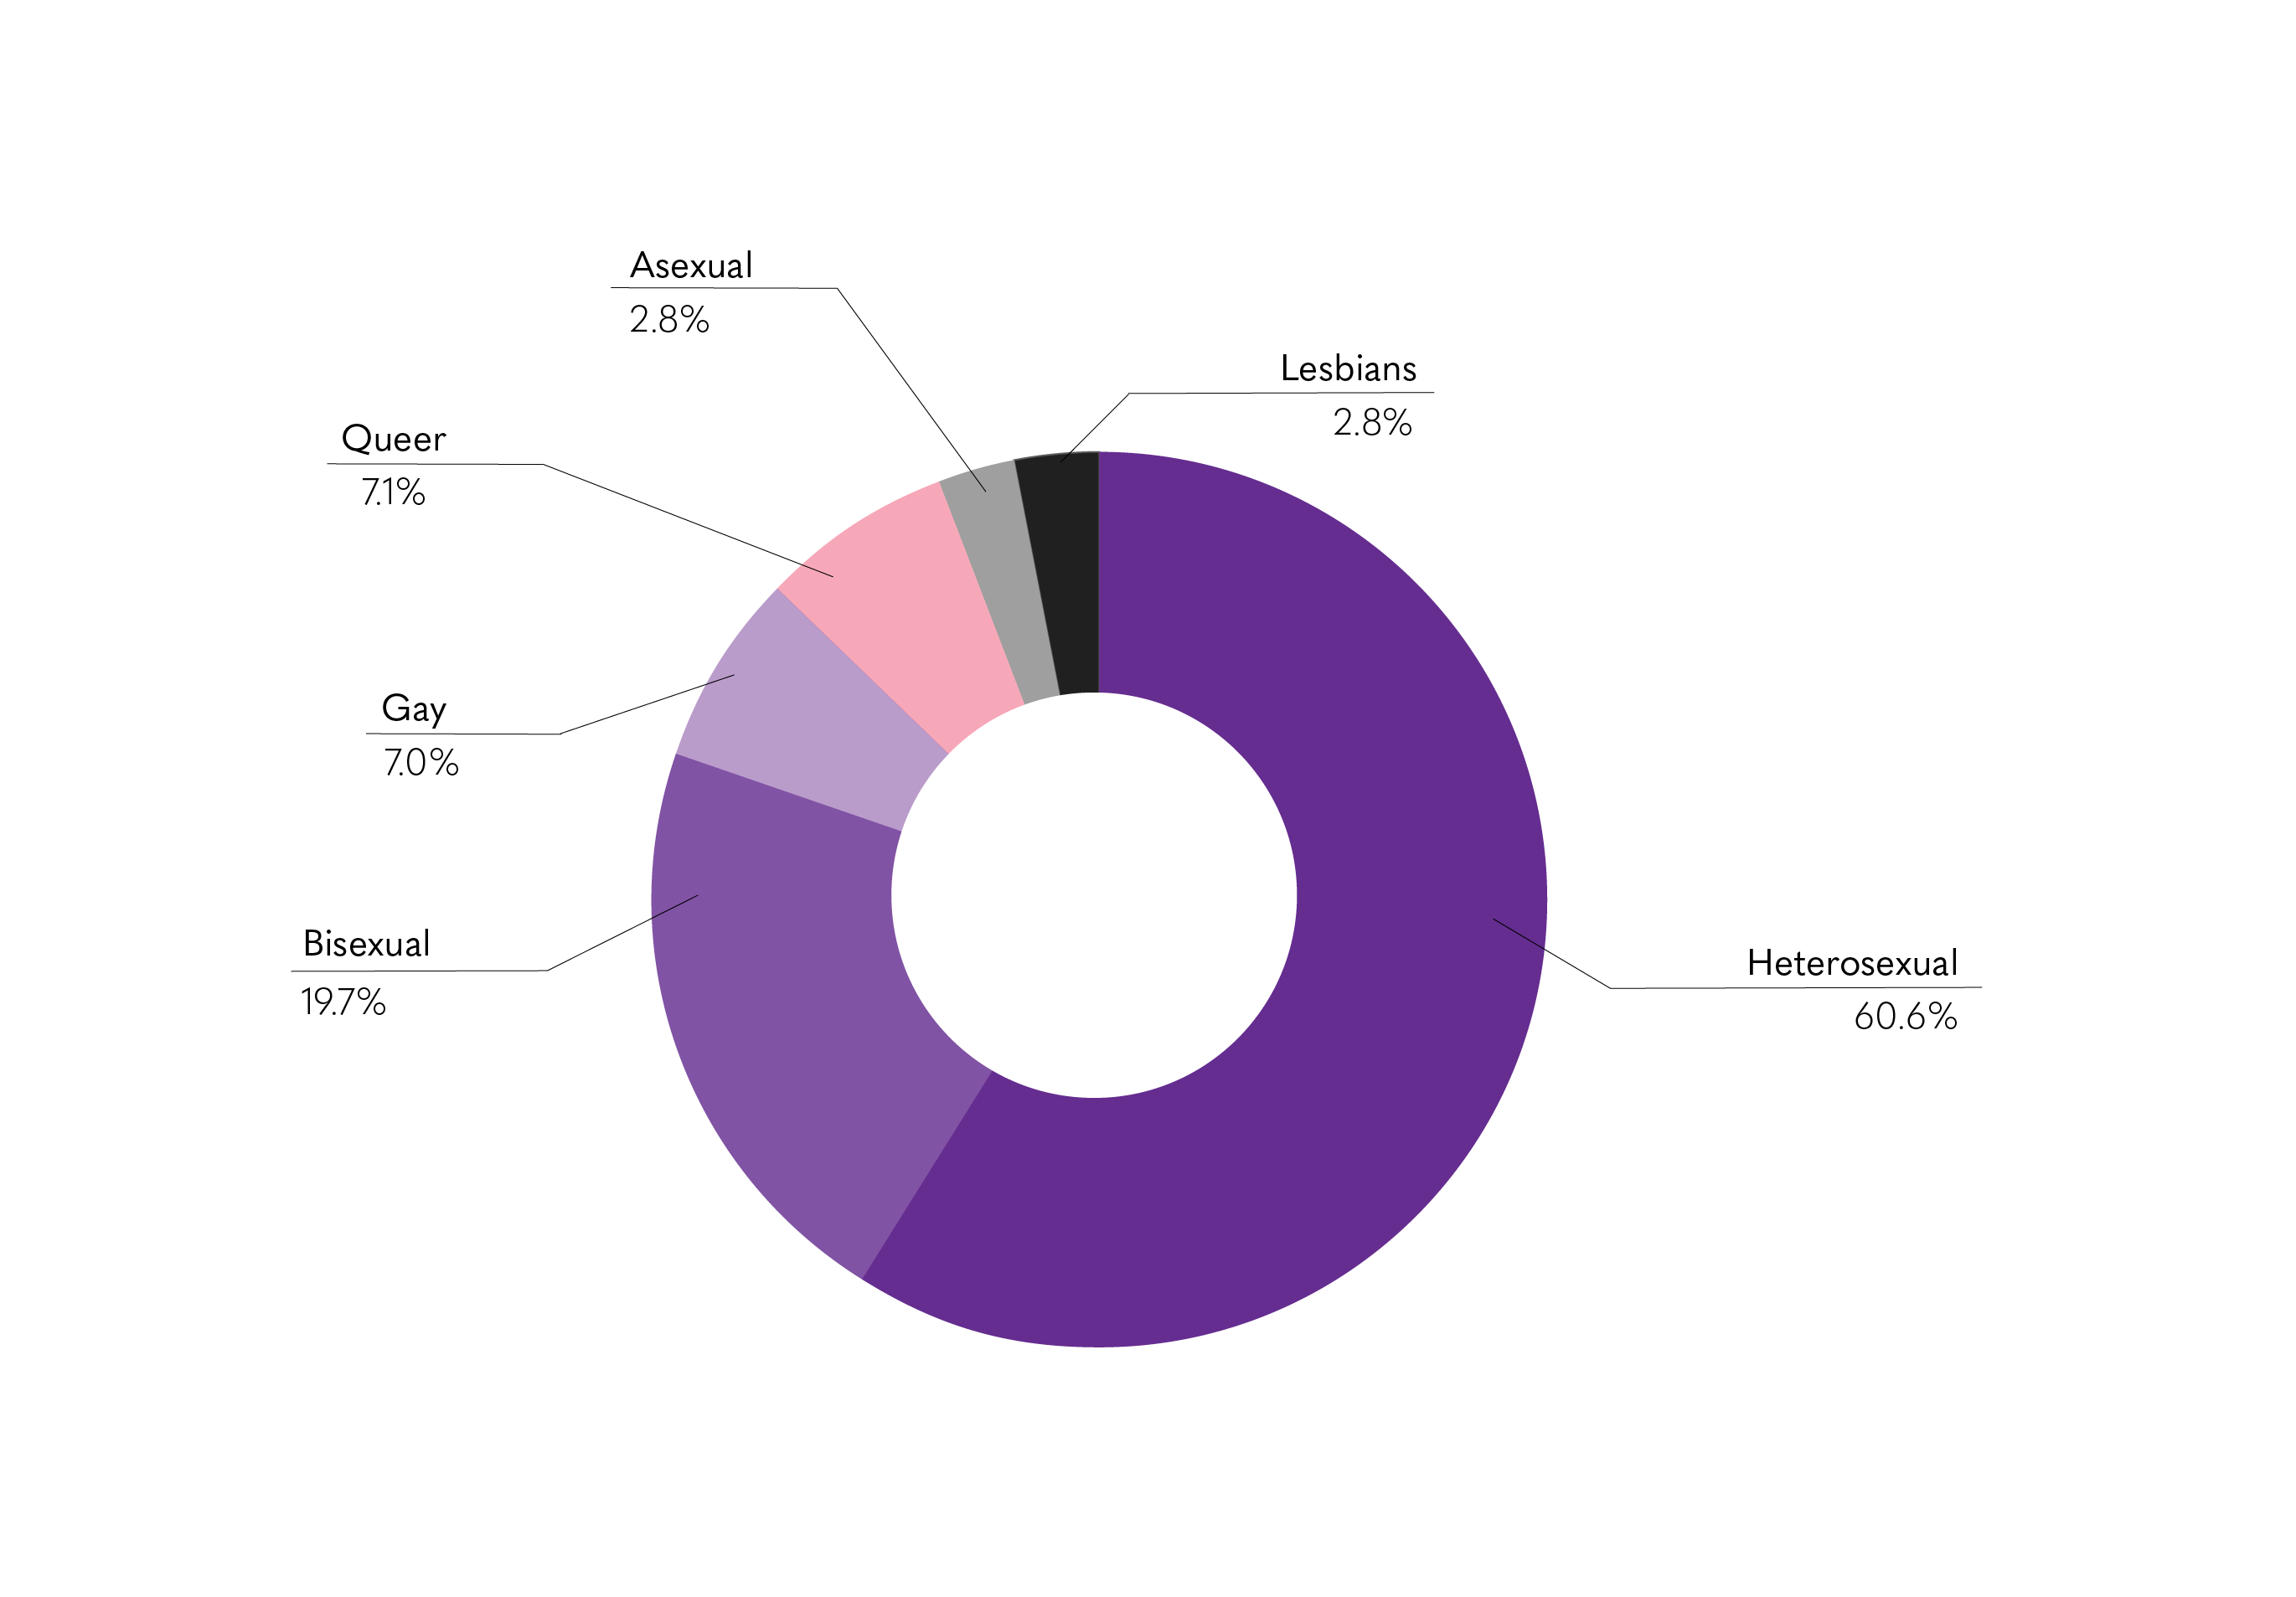
NBN’s Spring and Fall statistics for sexuality, respectively.
About 59.7% of our staff identifies as heterosexual while the remaining 40.3% identifies as another sexuality. Since Winter 2021, the percentage of each group has only fluctuated within a five-percentage point range. In Fall Quarter, only one respondent identified as having multiple sexualities, and two respondents skipped this question.
Outside of heterosexuality, bisexuality remains the most represented sexuality each quarter. In Fall, 51.9% of respondents who indicated a sexuality other than heterosexual identified as bisexual. Members of the LGBTQ+ community continue to be overrepresented on NBN’s staff: according to a 2021 study by Gallup, only 15.9% of Gen Z adults identify as LGBTQ+.
Language
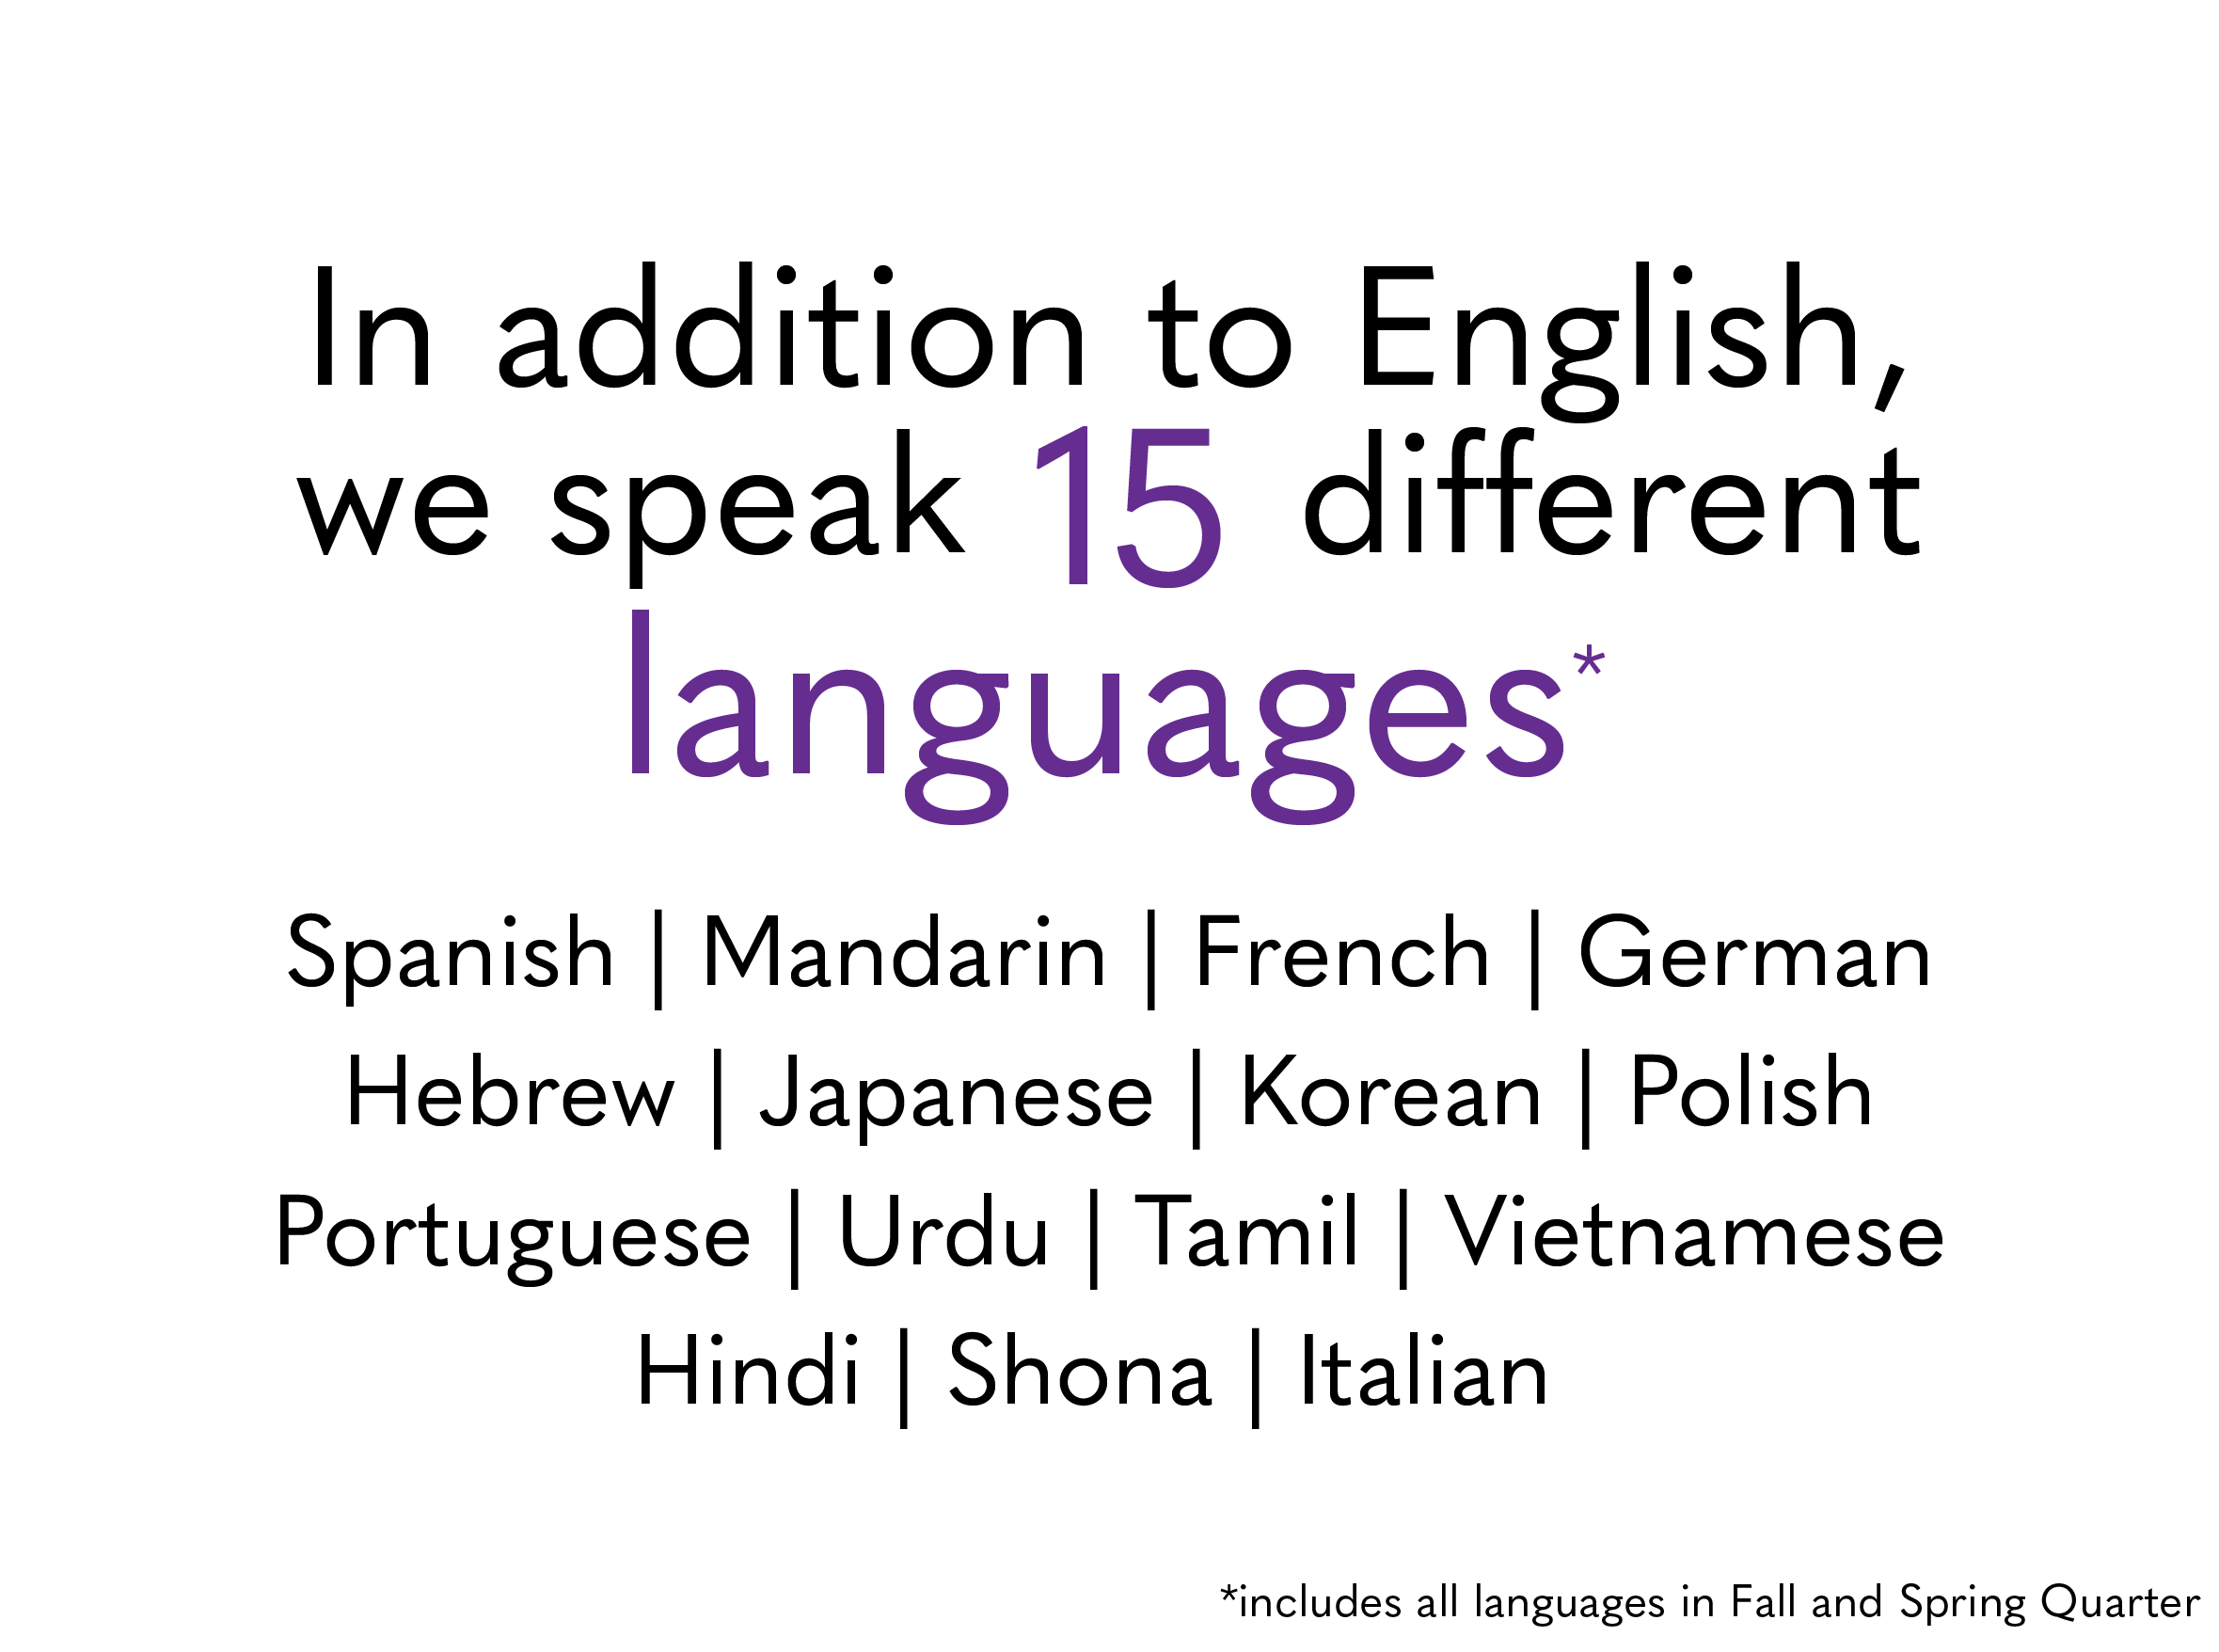
The languages NBN spoke in Spring and Fall.
During Spring and Fall Quarters, members of the NBN staff spoke a combined total of 15 different languages other than English – 11 in Spring and 13 in Fall. The most spoken languages among staff members were Spanish with 15 in Spring and 16 in Fall, Mandarin with 11 in both Spring and Fall, and French with 10 in Spring and three in Fall. During these two quarters, NBN staff members also spoke German, Hebrew, Japanese, Korean, Polish, Portuguese and Vietnamese. Italian and Shona were spoken in the Spring but not the Fall while Hindi, Tamil and Urdu were spoken in the Fall but not the Spring.
International students
The Spring 2021 survey was the first time NBN asked its staffers if they are international students. In Spring, 10.4% of survey respondents said they were international students. In Fall, this percentage fell to 6.9%. Compared to the Northwestern community, international students are slightly underrepresented. They make up 20% of all full-time students and 10% of full-time undergraduate students according to a 2021 statistical report by the University’s Office of International Students and Scholar Services. In future diversity surveys, NBN will allow international students to indicate their country of origin to get a better sense of which countries are represented on our staff.
Socioeconomic background
To get a more holistic view of the socioeconomic background of our staff, we decided to ask students in Spring and Fall whether they receive financial aid from the University. First-generation students made up approximately 9.7% of staff in Fall, an increase from the first-gen students on staff in Winter and Spring, who made up approximately 7% of staff each quarter. First-generation students are underrepresented in NBN’s newsroom; according to a report by Northwestern, 13% of the class of 2023 and 13.2% of the class of 2024 are first-generation.
Last Winter Quarter, 12.7% of NBN staff identified as low-income, which rose to 15.2% in Spring and fell to 13.7% in Fall. The low numbers of low-income and first-generation students at NBN may be caused in part by the time commitment required to join a student publication. Students from low-income or first-generation backgrounds may need to spend more time working than other students to help their families or contribute to their tuition costs. In future diversity reports, NBN hopes to collect data on how staffers balance NBN with jobs or other outside commitments.
Separately, about 60.3% of staffers said that they received financial aid from Northwestern in Fall 2021, a relatively similar figure to the 56.1% of staffers from Spring 2021 who received financial aid. According to the University, 61% of undergraduate students receive financial aid. Given that Spring 2021 was the first time NBN asked about financial aid, there is no data to compare from Winter.
Religious affiliation
In terms of religious affiliation, the largest group has remained respondents who identify as agnostic since Winter Quarter. This number fell from 26 in Winter to 18 in Spring before rising to 22 in Fall. The second-largest group is still those who identify as Christian; the number remained stable at 16 in Winter and Spring but rose to 19 in Fall Quarter. Other respondents identified as Atheist (15 in Winter, 14 in Spring, 12 in Fall), Jewish (10, 9, and 7 respondents respectively) and none or not practicing (7, 12, and 14 respectively). Eight respondents indicated more than one religious affiliation in Spring, which fell to seven in Fall.
Disability
This is the first quarter we included a question addressing disability on our diversity report, an addition requested by staff feedback. While having a question on our diversity report does not completely solve a lack of representation in our coverage, it does allow for a more accurate picture of who is a part of NBN. It is also the first step in improving our coverage of disability within the Northwestern community.
Of the 73 survey respondents, 83.6% answered that they did not have a disability and 12.3% said that they did have a disability. Three respondents skipped this question. This distribution mirrors that of the Northwestern population; as of the 2020-21 school year, 12.3% of the undergraduate population was registered with AccessibleNU. While we recognize that not all Northwestern students with disabilities are registered with AccessibleNU, this was the best metric North by Northwestern could find to compare our own data with.
Takeaways and next steps
Every quarter that we offer our diversity survey, aim to ask better questions that reflect the identities of staff at North by Northwestern. Over the coming quarters, the questions we ask and the methods we use to collect data will likely continue to shift as we do our best to accurately represent the students who make up our staff. As we previously mentioned, for the Winter 2022 survey, NBN plans to ask international students about their countries of origin so we can better understand the countries and cultures represented within our newsroom. We will continue to modify the survey in response to feedback from our staff and community so it can best represent NBN.
To connect with the greater Northwestern community, North by Northwestern will begin holding affinity space events for marginalized community members. These events will not be limited to students who work for NBN or even students involved in campus publications. Our intention is to hold space for students to connect and find community outside of meetings. These affinity spaces are not designed to be transactional or outwardly motivated. Students are encouraged to attend even if they have no intention of joining our staff.
Another effort NBN makes to encourage diversity, equity and inclusion among its staff is a quarterly dialogue. These topics are important for new and returning staffers alike, so we will continue to hold a dialogue each quarter. In the past, these dialogues have been held toward the end of the quarter and, while they were mandatory, attendance was not enforced. This quarter, we held the dialogue earlier – during week three rather than week nine – to ensure our staffers keep these values in mind while they work for us throughout the quarter. We invited Medill professors Christopher Benson and Ava Thompson Greenwell to lead the dialogue, answering student questions and discussing their experiences in the industry while inviting staffers to discuss their experiences as well. We hope to send out a mid-quarter survey and hold a follow-up dialogue closer to the end of the quarter to see how our staff has internalized these values and what steps they have taken to further these goals in their own reporting, writing and editing throughout the quarter.
One area in which we hope to improve is tracking the diversity of our sources. In the Winter 2021 diversity report, we said we wanted to work toward implementing asking sources to voluntarily self-identify. This way, we can hold ourselves accountable for representing marginalized identities within our reporting. As of the publication of this report, NBN still does not track diversity in its sources. Through the rest of the Winter Quarter and the coming Spring, we hope to pick up the slack in this area and push to track the diversity of our sources like we said we would a year ago. As a reader and member of the NBN community, you can expect an update on this effort when we release our Winter 2022 and Spring 2022 diversity reports later this year.
Thumbnail and graphs by Bailey Richards / North by Northwestern